123FormBuilder Knowledge Base
Search our documentation platform for answers, service specifications and 3rd-party integrations.
Reports with Charts & Graphs on 123FormBuilder
Form reports provide a structured overview of the users’ input so that you can figure out quickly what the option distribution is. You can generate reports for all Dropdown lists, Single choice fields, Multiple choice fields, and Likert Scales within the form builder. You can use different types of reports, such as charts, data tables, text reports, and number reports.
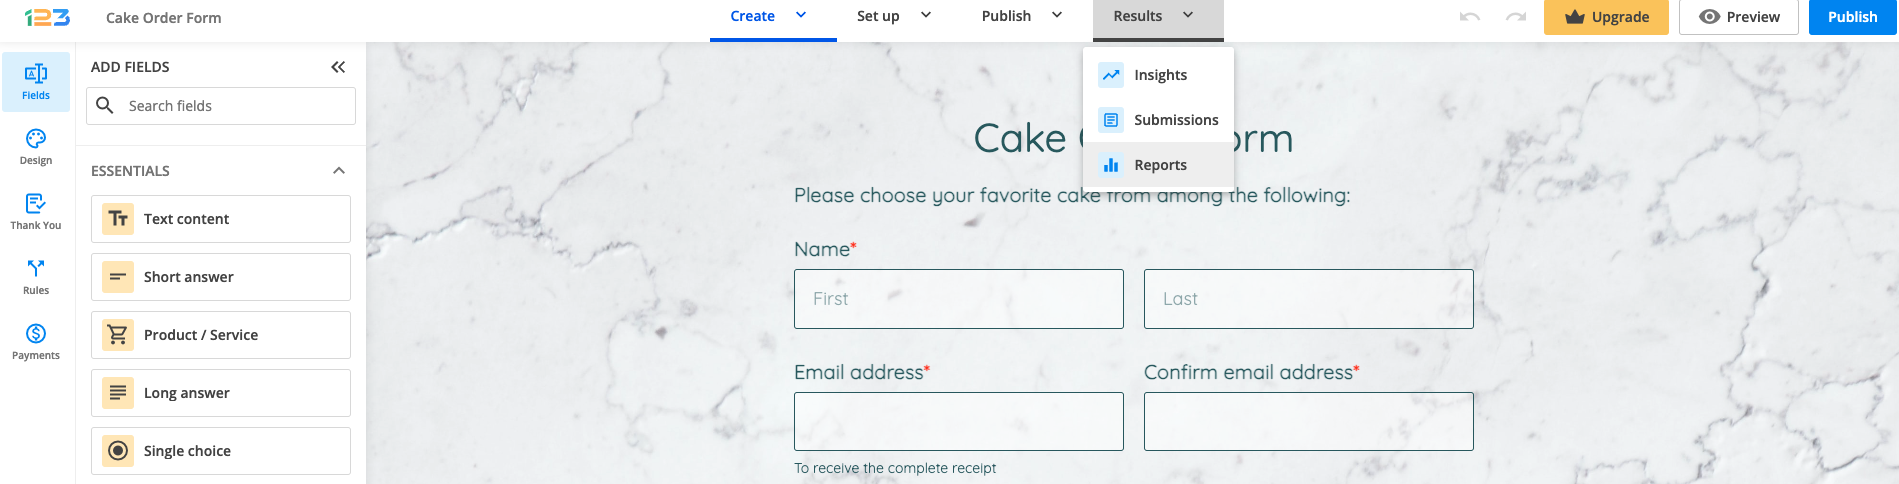
To access the Reports section, first, select the Results button from the Form Editor, then select Reports.
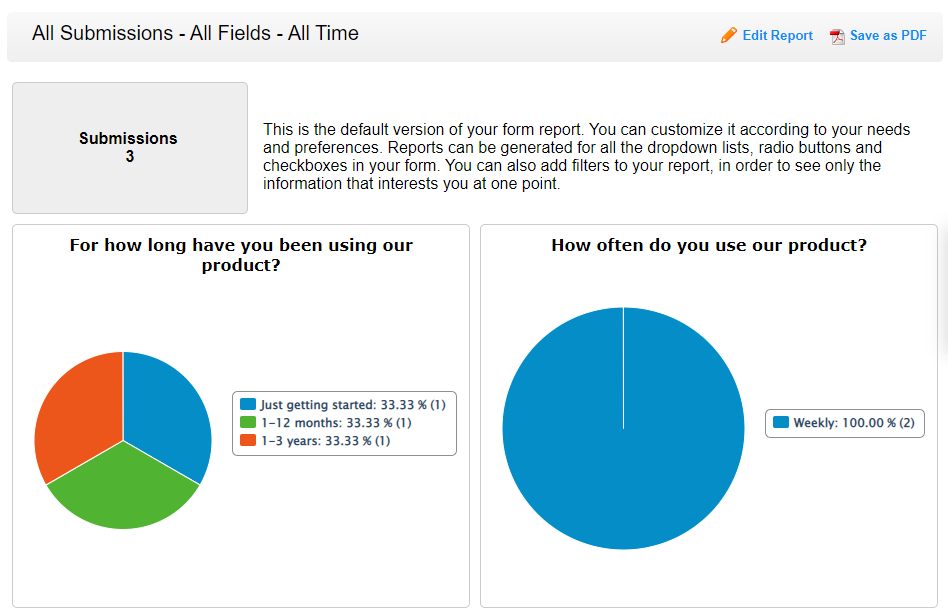
When you first access the Reports section for a form, you see the default report, which contains all form fields, shown in pie charts, in the order that they appear in your form.
Reports will update automatically after submission. Therefore, you don’t need to worry about updating them yourself each time you receive a new submission on your form.
Related articles
Similar Articles
Frequently Asked Questions
Here is a list of the most frequently asked questions. For more FAQs, please browse through the FAQs page.
1 comment